
Credit: BIG MOUTH for Quanta Magazine.
Can you find the next number in this sequence?
1, 2, 4, 8
Here’s another number, in case you need a little more data before deciding.
1, 2, 4, 8, 16
The next number has to be 32, right? The pattern is clear: To find the next number, double the current one. We have 1 × 2 = 2; 2 × 2 = 4; 4 × 2 = 8; 8 × 2 = 16. The next number should be 16 × 2 = 32. How much more evidence do we need?
While it’s perfectly reasonable to believe the next number is 32, it happens to be wrong. Consider the following sequence.
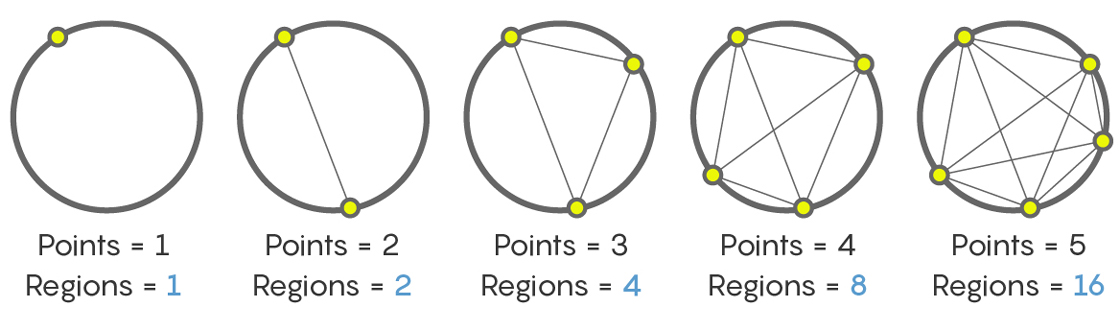
Here we are counting the regions formed by connecting points on a circle. One point yields one region (the interior of the circle); two points yields two regions; three points yields four regions. Four and five points yield eight and 16 regions, respectively. This gives us the sequence:
1, 2, 4, 8, 16
So, how many regions are created by connecting six points on a circle?

You’d be forgiven for thinking, like everyone else who first meets this problem, that the answer is 32. But it’s not. The answer is an annoying 31 regions! Count them yourself. And count them again to be sure.
Of course, there are patterns that go 1, 2, 4, 8, 16, 32, 64, and so on, doubling each term. But there are also patterns, like the maximum number of regions formed by connecting points on a circle, that go 1, 2, 4, 8, 16, 31, 57, 99, and so on. When we see the sequence 1, 2, 4, 8, 16, we might think all the evidence points to the next term being 32, but it could be something else.
Mathematics has a long history of defying expectations and forcing us to expand our imaginations. That’s one reason mathematicians strive for proof, not just evidence. It’s proof that establishes mathematical truth. All available evidence might point to 32 as the next number in our sequence, but without a proof, we can’t be certain.
Still, evidence is important and useful in mathematics. Often, before proving something, we play around, explore, consider examples and collect data. We examine and weigh the evidence and decide what comes next. These results shape our opinions, suggesting that we should try to prove some theorems but disprove others.
The twin primes conjecture is one example where evidence, as much as proof, guides our mathematical thinking. Twin primes are pairs of prime numbers that differ by 2 — for example, 3 and 5, 11 and 13, and 101 and 103 are all twin prime pairs. The twin primes conjecture hypothesizes that there is no largest pair of twin primes, that the pairs keep appearing as we make our way toward infinity on the number line.
The twin primes conjecture is not the Twin Primes Theorem, because, despite being one of the most famous problems in number theory, no one has been able to prove it. Yet almost everyone believes it is true, because there is lots of evidence that supports it.
For example, as we search for large primes, we continue to find extremely large twin prime pairs. The largest currently known pair of twin primes have nearly 400,000 digits each. And results similar to the twin primes conjecture have been proved. In 2013, Yitang Zhang shocked the mathematical world by proving that there are infinitely many prime number pairs that differ by 70 million or less. Thanks to a subsequent public “Polymath” project, we now know that there are infinitely many pairs of primes that differ by no more than 246. We still haven’t proved that there are infinitely many pairs of primes that differ by 2 — the twin primes conjecture — but 2 is a lot closer to 246 than it is to infinity.
For these reasons and more, believing that the twin primes conjecture is true, even though it hasn’t been proved, isn’t very controversial. But there are other areas of math where evidence is being used to inform opinion in more controversial ways.
In the study of elliptic curves, the “rank” of a curve, roughly speaking, is a numeric measure of how complex that curve’s solutions can be. For many years the consensus view has been that the ranks of elliptic curves are unbounded, meaning there is no limit to how high a curve’s rank, or how complex its solutions, can be.
But recent work has some mathematicians thinking that ranks may be bounded after all. The work presents evidence suggesting that, just maybe, there are only finitely many elliptic curves whose rank is greater than 21.
Still, there are reasons to be cautious. The compelling evidence they’ve collected doesn’t come from the world of elliptic curves. It comes from the world of matrices, which the researchers used to model elliptic curves. Mathematical models are used everywhere in science and can even be turned inward to study mathematics itself. They are incredibly powerful tools that allow us to trade a problem we don’t fully understand for one we have a better handle on.
But using models is inherently tricky. We can never be certain that our model behaves enough like the thing we are actually trying to understand to draw conclusions about it. Nor can we be sure that our model is similar enough in the ways that really matter. So it can be hard to know that the evidence we collect from the model is truly evidence about the thing we want to know about. Let’s explore some of these issues using a simple model of a simple conjecture.
Imagine we want to investigate the following claim: Any two lines either intersect or are parallel.
By “intersect” we mean the lines share a point in common, and by “parallel” we mean they go off in the same direction but do not intersect. (There are different ways to define parallelism, but we’ll go with this for simplicity).
To investigate this claim we will create a model. We’ll imagine each line to be in “slope-intercept” form, which you may remember from algebra class. That is, we’ll assume that every line can be written as an equation:
y = mx + b
where m is the slope of the line (essentially its steepness) and b is the y-intercept (where it passes through the vertical axis).
Modeling lines in this way gives us a convenient way to experiment with them. The model lets us create a random line by picking a pair of random numbers, m and b. Thus, we can pick a pair of random lines and test them: Do they intersect? Do they point in the same direction? Or does something else happen?
Here are some examples of what such experimentation might look like.
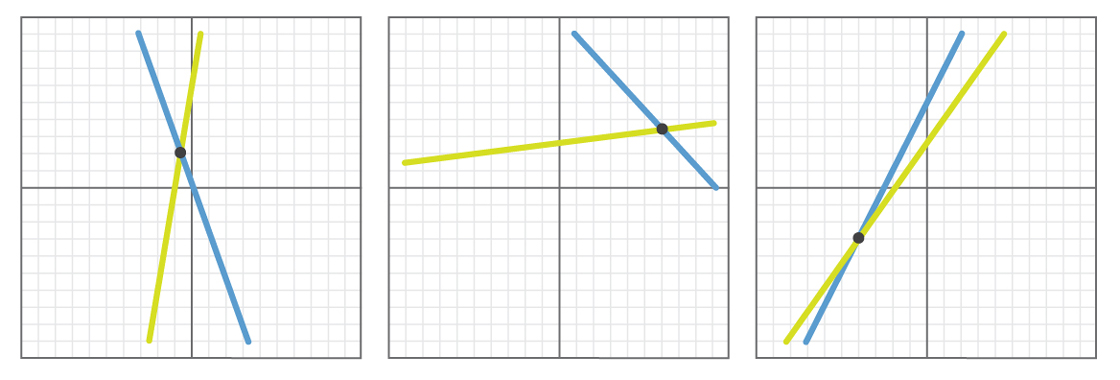
In each example above, we see that the randomly selected lines intersect. If we tried this experiment 1,000 times — or 10,000 times or 1 million times — we would that find that, in all cases, the lines would either intersect or be parallel. (In fact, all pairs of lines would probably intersect, since it’s unlikely that the exact same slope will be chosen for both lines.)
So after looking at 1 million examples, you might come to the conclusion that the conjecture is probably true. All the evidence overwhelmingly supports the claim that any pair of lines either intersects or is parallel.
But evidence is only as good as the model, and modeling can be dangerous business. Let’s see what danger we’ve created for ourselves.
One problem is that certain kinds of lines seem more likely to be chosen than others. Here’s a graph showing 50 lines with b = 0 and 0 ≤ m ≤ 1.

And here is a graph showing 50 lines with b = 0 and m ≥ 1.

It appears that a quarter of the plane is covered by lines with slopes between 0 and 1, and another quarter of the plane is covered by lines with slope greater than 1. Choosing a number larger than 1 seems much more likely than choosing a number between 0 and 1, thus a line is much more likely to be selected from the second region than from the first. This means certain kinds of lines — those with slopes between 0 and 1 — could be vastly underrepresented in our model. If strange things are happening with lines in that region of the plane, our model is very unlikely to tell us about it.
A closer look at the second graph suggests another problem. As m gets larger, the lines get steeper. The steepest possible line is vertical. What is the slope of a vertical line? By definition, the slope of a vertical line is undefined: There is no number m we could choose to create a vertical line. That means these lines don’t exist in our model, and so we will never be able to experiment with them. Before we even begin collecting evidence, we have excluded these possibilities by design.
And this speaks to the heart of the most serious issue with our model. Anyone comfortable thinking three-dimensionally probably noticed right away that our conjecture is false. Lines do not only have to either intersect or be parallel. Imagine two hallways running in different directions on different floors of a building. These are examples of “skew” lines — lines that do not intersect and are not parallel.

The important fact about skew lines is that they must lie in different planes. But since our model identifies every line with an equation y = mx + b, we automatically imagine every line in the same plane. Our model will only generate evidence supporting our conjecture, because if two lines lie in the same plane, it is true that they must either intersect or be parallel. We’ll never see any evidence suggesting otherwise: Skew lines don’t exist in our model. Just as we saw with vertical lines, our model has excluded what we failed to imagine.
This is a simple example using a silly model with lots of issues, including pesky questions about how we choose random numbers from infinite sets. The professional mathematicians exploring the rank of elliptic curves would never make the kind of simplistic and obvious errors highlighted here.
Those mathematicians know to be cautious when working with their models. Because they know that no matter how useful and interesting their model, no matter how compelling the evidence they collect, there might be something out there about elliptic curves that they didn’t quite imagine. And if you can’t imagine it, your model can’t capture it, and that means the evidence won’t reflect it.
But right or wrong, this new model has mathematicians thinking productively about elliptic curves. If the model really does reflect the truth, insight from the world of matrices might explain why elliptic curves behave the way they do. If it doesn’t, figuring out why elliptic curves can’t all be modeled this way might also lead to a deeper understanding of the problem. The evidence we collect may lead us closer to proof, one way or another.
Patrick Honner teaches mathematics and computer science in New York City.